Unified Operational Intelligence
Restaurant operations intelligence: one view of every location
One operating view of every restaurant
Connect what your systems expected, what physically happened, and the business outcome—in one shared operating model across every item, order, shift, channel, and location.
Ask operations
The Visibility Gap
Your systems know what was ordered. Do you know what actually happened?
Plainsight connects POS and KDS data with what physically happens in every restaurant, so operators can catch execution gaps, understand their financial impact, and improve performance across every location.
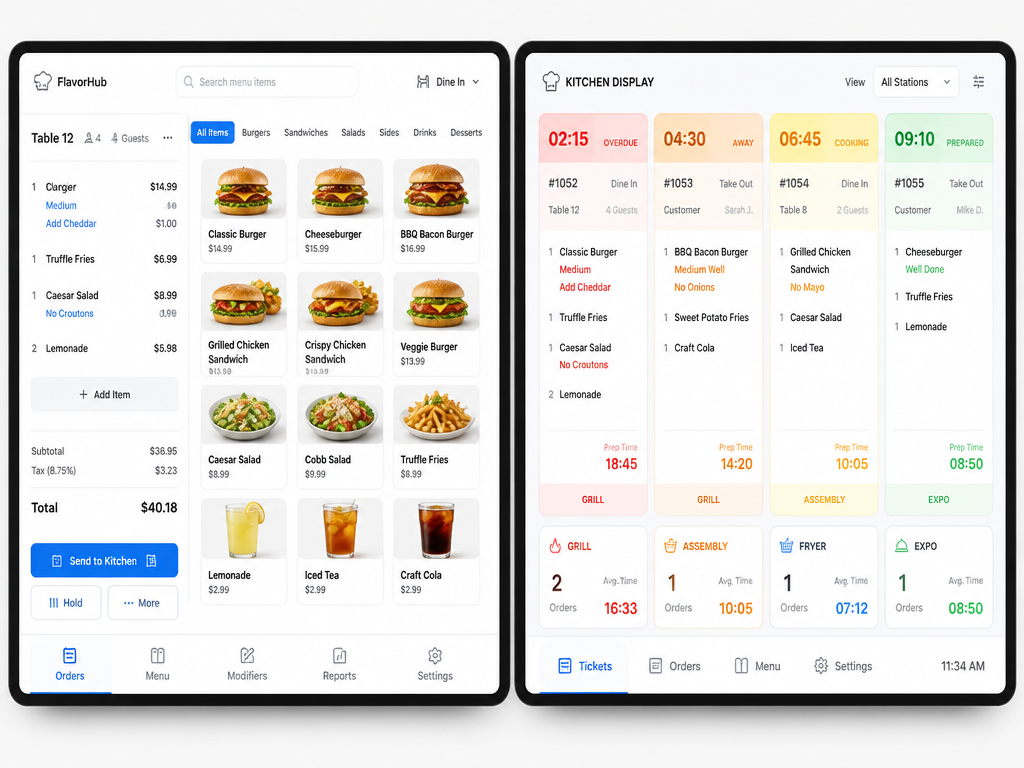
POS and KDS
What was ordered, planned, or expected.
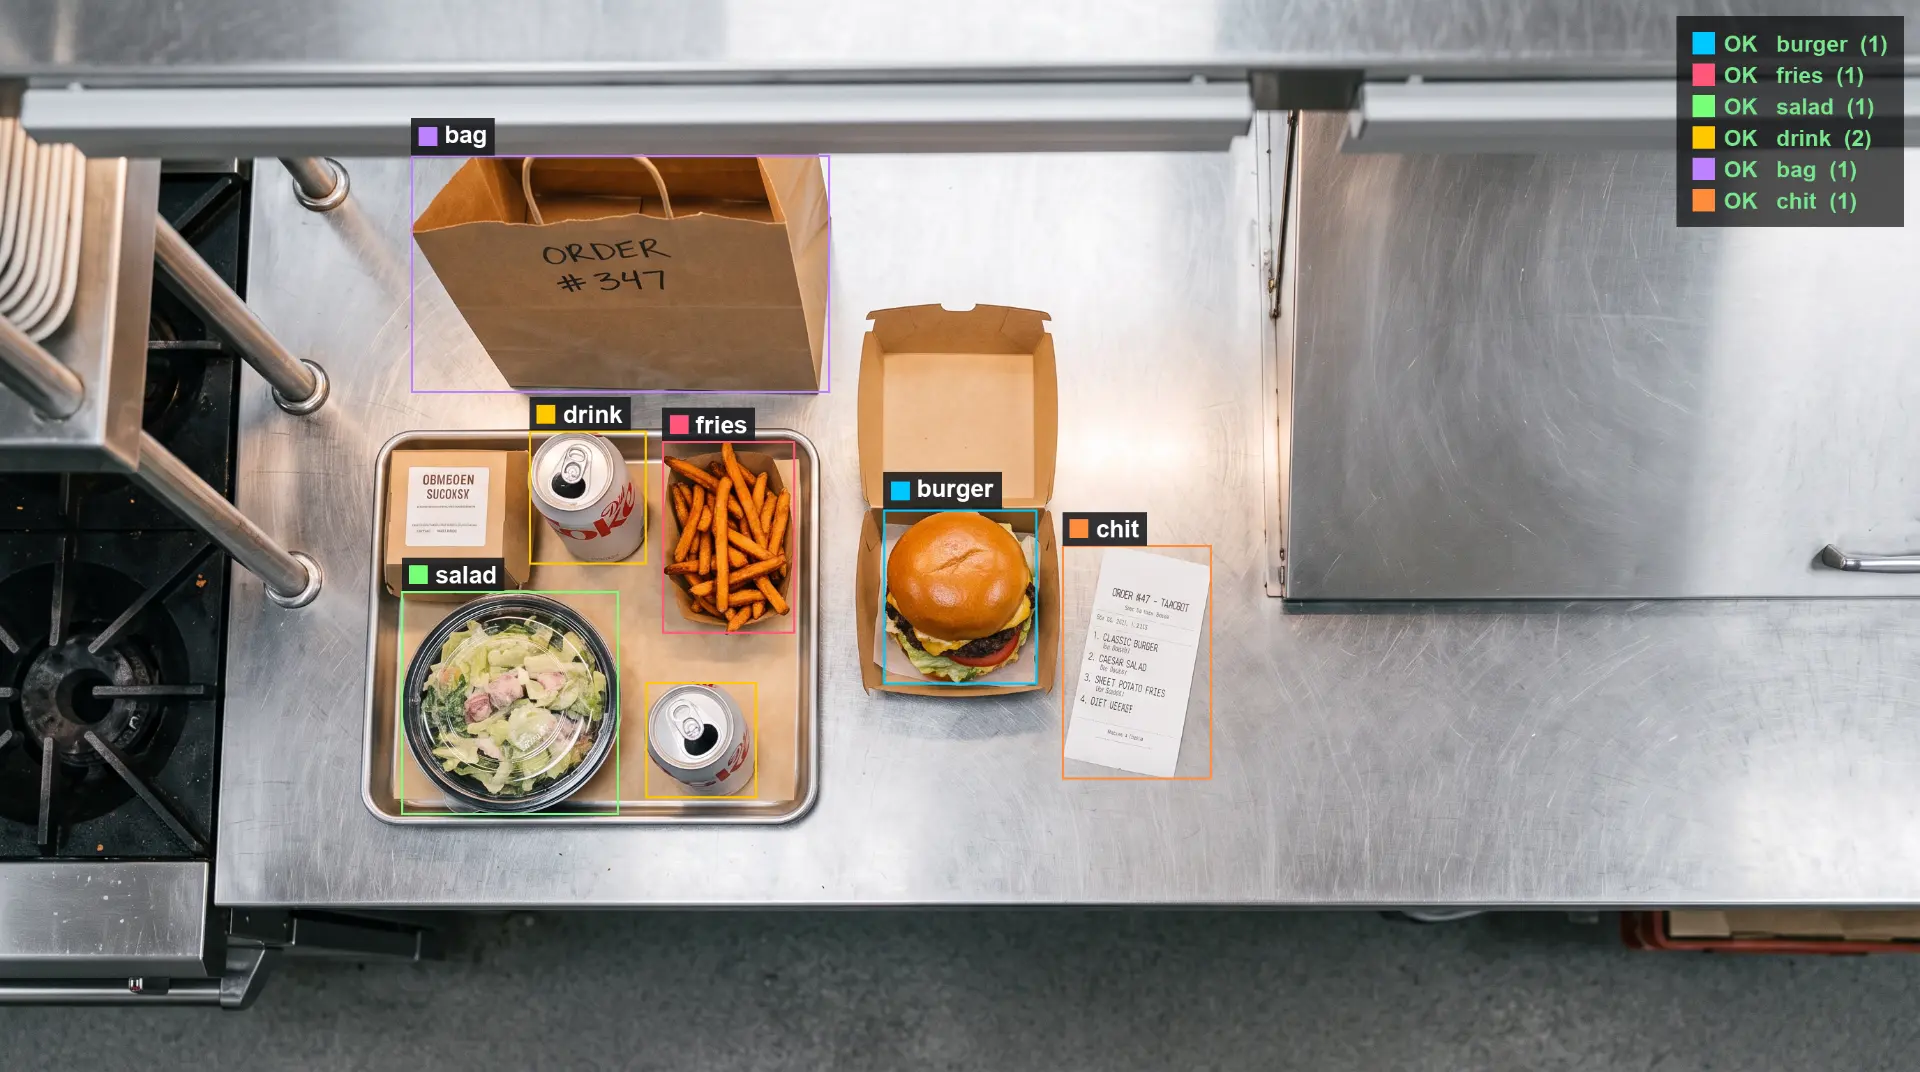
Physical execution
What physically happened inside the restaurant.
Business outcomes
Execution to financial impact
Business outcomes
What it costs, changes, or improves.
Plainsight connects all three.
Unified Operations View
“Why is Store 52 behind on accuracy?”
Ask the question and the answer is already assembled: accuracy trend across all stores, the locations moving up or down, and the station and daypart driving the gap—so the next action is obvious.
Sliced by item, station, shift, daypart, channel, location, region, and brand.
Unified operations view
Intent + execution, one scorecard
Ordered
14,284
from POS
Made
13,921
from cameras
Accuracy
97.5%
+0.8% vs last week
Refund rate
2.1%
-0.4% vs last week
Digital mix
38%
off-premise orders
Accuracy Trend - All Stores
7 days
Top error items
- Missing modifier14212%
- Wrong side item988%
- Incomplete drink7621%
- Missing entree item543%
- Store 04298.7%+1.2 pts
- Store 08796.4%−0.4 pts
- Store 01493.8%−1.9 pts
Order Accuracy exposure calculator
Use your own assumptions. Nothing is submitted, and your results appear immediately.
From Data to Business Impact
Small execution gaps become enterprise-level costs.
A single mistake may seem insignificant. Across millions of orders and hundreds of locations, connected data lets leaders identify what broke down, quantify what it costs, and improve it.
Questions leaders can finally answer
Was the order made as entered?
Where did execution break down?
Which workflows create delays?
What is driving refunds and remakes?
Which locations consistently outperform?
What should Operations address first?
Where the impact shows up
How It Works
Turn physical operations into structured business data.
Connect system intent
Bring in the orders, modifications, and expectations captured by POS and KDS systems.
Observe physical execution
Use computer vision to understand what happens across restaurant workflows.
Create a shared operational model
Connect every event to the relevant item, order, station, shift, channel, and location.
Surface business impact
Show where execution differs from intent and how that affects operational outcomes.
Prove Repeat Scale
Prove the operating model in a controlled environment.
Begin with one use case, one restaurant, and agreed success criteria. Expand only when customer-supported evidence justifies the next investment.
Test Kitchen
Validate Order Accuracy against real orders in a controlled restaurant environment.
Repeat
Confirm results across additional locations, layouts and operating conditions.
Scale
Deploy the proven operating model across the enterprise.
Applications
One operating model. Multiple operational applications.
Most teams start with Order Accuracy, then extend the same intelligence layer across the restaurant.
Food Order Accuracy
Plainsight compares what the POS and KDS expected with what was actually prepared and handed off—then connects deviations to refunds, remakes, labor, and customer outcomes.
Explore Order AccuracyOrder #4281 · Window 3
Assembly Check
1 missing item: hold order
Assembly 2 is limiting throughput
62 orders per 5 minutes
- Prep A92%
- Grill74%
- Assembly 2 — Bottleneck41%
- Window83%
Recommended action: Reassign support to Assembly 2.
W
92
+3.1
NW
87
+1.4
SE
78
-0.8
S
71
-2.6
- 1Store 1142W96
- 2Store 0318NW93
- 3Store 2207W91
- 4Store 0874SE76
- 5Store 1590S68
Multi-Location Benchmarking
Compare execution across stores, regions, and formats on one standard.
Integrations
Built to work with the restaurant systems you already run.
Plainsight connects order intent from restaurant systems with physical execution data, without requiring operators to replace their existing systems of record.


Don't see your system? Plainsight exports events through open APIs and webhooks, so it connects to virtually any POS or KDS.
Start with one operational question.
Choose a high-value workflow, define what success looks like, and prove the impact before scaling.
In restaurants, Plainsight powers restaurant order accuracy, drive-thru analytics, back-of-house inventory visibility, service speed and throughput, SOP and food-safety compliance, and multi-location benchmarking.